Never miss a story — sign up for PLANADVISER newsletters to keep up on the latest retirement plan adviser news.
Thought Leadership March 17, 2020
State of the participant 2020: readiness within reach
Reflections on retirement readiness and ideas for improvement
Sponsored by John Hancock
John Hancock’s “State of the participant 2020” is a look inside the status and success of the people who participate in our defined contribution (DC) retirement plans.1 We analyze their behavior, the outcomes they’re experiencing, and how it all affects their journey toward a secure retirement.
For a full analysis, including tips for optimizing your approach, download our full report.
Below, you’ll find illustrations and commentary about:
- The state of retirement readiness overall
- The impressive outcomes of auto features
- Participants’ approach to investment strategies
A retirement-ready majority is within reach
If preparing workers to retire is the ultimate purpose of a DC plan, then retirement readiness is a critical measure of a participant’s and a plan’s status and progress.
For benchmarking purposes, John Hancock defines retirement readiness as the expected ability for a participant’s projected assets at normal Social Security age to replace at least 70% of their preretirement earnings.2 Here’s how that looks across the plans in our data base.
The percentage of retirement-ready participants declines with age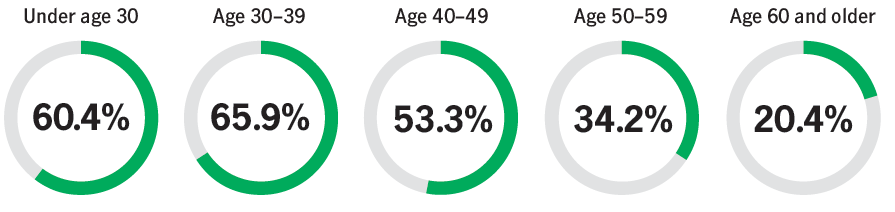
Participants under age 50 are more likely to be on track to a secure retirement, as beneficiaries of the Pension Protection Act of 2006 and successful innovations, such as auto-enrollment and auto-escalation.
With an understanding of which of your participants are retirement ready, you can use all the tools available—such as plan design, participant engagement, and the positive provisions in the SECURE Act—to help all participants on a sustainable path to retirement readiness.
Auto features are doing their job
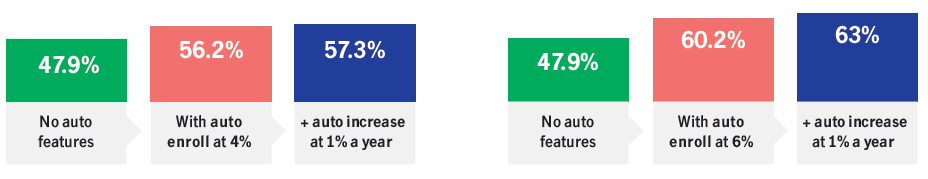
Automatic enrollment and automatic increase (which escalates employee contribution rates each year) can make a profound difference in supporting retirement readiness. The positive effects of these features come when they’re used together. Adding auto-enrollment with a 6% default rate and auto-increase of 1% can make 36% more participants retirement ready.
Impact of auto solutions on participants’ retirement readiness
Participants are green-lighting higher default contribution rates
Logically, you’d think that the higher the default contribution rate, the more likely eligible employees would opt out of enrolling. That’s simply not the case.
Nine out of ten plans with auto-enroll use default contribution rates between 3% and 6%. Yet, note the relatively small differences between opt-out rates within this range.
Auto enrollment opt out rates at various default contribution rates

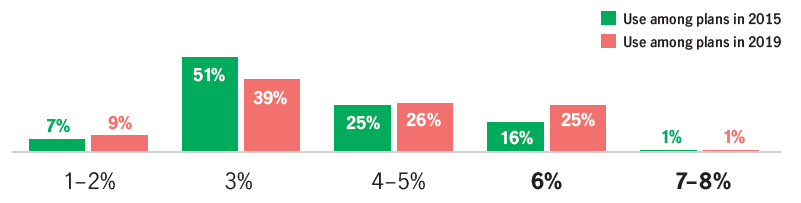
Participants are not more reluctant to save as the contribution rate increases. And notice what’s going on at the fringes. The highest opt-out rates happen with the lowest default contribution rates, while opt-outs are lowest among the plans with the highest default rates—7% or 8%. It seems that many plan sponsors have factored this data into their plan designs. While the 3% default contribution rate is still the most popular among auto-enroll plans, the shift toward higher default rates (between 4% and 6%) has been significant over the past four years.
Default contribution rates for plan with auto-enrollment, 2015-2019
Many self-directed investors could use a nudge
To measure the age appropriateness of a participant’s investment approach, John Hancock applies the following target equity ranges.
Benchmark for percentage of portfolio investment in equites, by age ranges
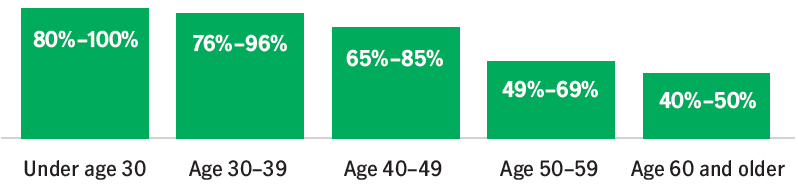
John Hancock’s target equity ranges shift with age to reflect the concept of balancing growth potential with risk management as participants approach their anticipated retirement date—a key component in creating adequate retirement income. A look at the current asset mix of participants who choose their own investments shows that many are outside their age-appropriate ranges, holding either too much or too little in equity investments.
Percentage of self-directed investors3 falling within or outside their target equity range

The percentage of participants who are overly conservative starts relatively high, reflecting the fact that many younger participants tend to be market shy. Conversely, relative aggressiveness increases with age, as older participants play catch-up by relying on stock investments.
Taken all together, these numbers indicate that all populations could use some help maintaining the right balance, whether it’s through education, direct advice, or an introduction to managed accounts or target-date fund (TDF) investing.
Using a managed account can help participants save more and invest more wisely. According to Morningstar, using a managed account can be of great benefit to participants who have, for example, been investing on their own and aren’t on track for retirement. In that firm’s estimation, an average 30-year-old in this situation could expect 56% more annual retirement income by moving to a managed account.4
Most TDF investors use them as prescribed
TDFs can help ensure age-appropriate investing when participants use them appropriately. We looked at our universe of TDF investors to discover which are limiting their investment to those funds and which might be corrupting their overall mix by also holding other types of investments.
Percentage of target date fund investors holding TDFs only vs those with TDFs and other types of funds
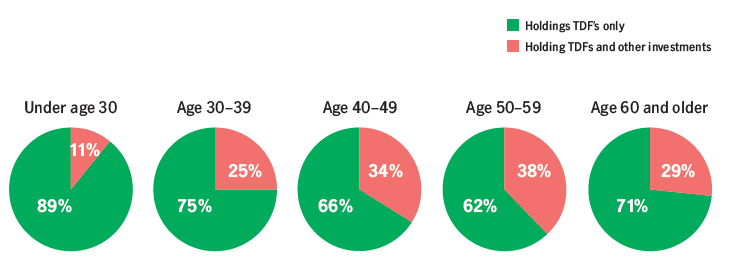
By limiting their portfolios to TDF investments, most holders of these funds are, in effect, providing themselves the chance to move through their fund’s chosen glide path. The very high percentage among younger participants may be due, in part, to the popularity of TDFs as default investments.
The target date is the expected year in which investors in a target-date portfolio plan to retire and no longer make contributions. The investment strategy of these portfolios is designed to become more conservative over time as the target date approaches (or, if applicable, passes) the target retirement date. Investors should examine the asset allocation of the portfolio to ensure it is consistent with their own risk tolerance. The principal value of your investment, as well as your potential rate of return, is not guaranteed at any time, including at, or after, the target retirement date.
Retirement program strategy, plan design, and participant engagement can help optimize retirement readiness
Virtually every plan decision has an impact on the potential success of its participants. Everything starts with the basics: getting people in the plan, saving enough, investing appropriately, and planning for how best to spend their savings. But when administration runs more smoothly, design is up to date, costs are fair and reasonable, and new government rules are skillfully applied, both plans and participants are better prepared for whatever’s ahead.
John Hancock’s consultative, data-driven approach has been refined over nearly 50 years of experience working with plans of all sizes and complexities. Our goal is to make sure all the pieces work together and offer all the support necessary to make retirement plans work for plan participants, sponsors, and financial representatives.
For more information, including a consultation or help with an RFP, contact your John Hancock representative or visit us at retirement.johnhancock.com.
1 All data is from our open-architecture platform, which included 1.2 million participants, 1,123 plans, and $77.48 billion in assets under management as of September 30, 2019, unless otherwise stated.
2 The inputs to this calculation include current age, salary, account balance, participant contribution, enrollment in auto-escalation, employer matching formula, pension eligibility, and projected Social Security benefit.
3 Self-directed investors exclude those holding one or two target-date funds, in a managed or brokerage account, or invested in a custom model portfolio.
4 “The Impact of Managed Accounts on Participant Savings and Investment Decisions,” Morningstar.com, 1/22/19.
The content of this document is for general information only and is believed to be accurate and reliable as of the posting date, but may be subject to change. John Hancock and its representatives do not provide investment, tax, or legal advice. Please consult your own independent advisor as to any investment, tax, or legal statements made herein.
John Hancock Retirement Plan Services, LLC, 200 Berkeley Street, Boston, MA 02116
NOT FDIC INSURED. MAY LOSE VALUE. NOT BANK GUARANTEED.
© 2020 John Hancock. All rights reserved.
MGTS-PS41171-GE 02/20 41171 MS012920507131
Sponsored by